
- Sixty-three percent of Democrats read a book in 2025, while 60% of republicans and 55% of independents did.
- There was a slight gulf in reading habits between Harris and Trump voters, at 69% to 64%.
As seen in previous polling of American reading habits, those who have more financial means are more likely to read. In families making more than $100,000 a year, 69% had read a book, while those making between $50 and $100K had 60% of their cohort read a book in the prior year. For the under $50,000 category, the percentage was 53%.
Lastly, regional differences in reading aren’t especially noteworthy. While those residing in the midwest read the least at 55%, neighbors in the northeast, south, and west ranked at 61%, 61%, and 60%, respectively.
Number of Books Read in 2025
Although 40% of those in the survey did not read a single book in 2025, among the 60% of those who did read a book, the variance in how many books they read was wide.
- 10% of those respondents read just two books, followed by 7% reading either three books or somewhere between 10 and 14 books.
- Only 6% percent of those who read dug into one book, while 5% read either four or five books.
Perhaps surprisingly, the next most common number of books read by those who had read at least one book in 2025 was 50 or more, at 4% of responses. That’s about a book every single week. Those responses were most commonly from people aged 30-44 or over the age of 65. They were also more frequently democrats who voted for Harris in 2024 and had an average family income between $50,000 and $100,000.
Insights on Book Format Preferences
Ebooks and audiobooks have increased in their availability and accessibility, but physical books still reign supreme when it comes to what readers are choosing. Even for those from families with incomes over $100,000 and presumably with more access to technology by which to read and acquire digital materials, physical books were much more commonly cited as the format read in 2025.
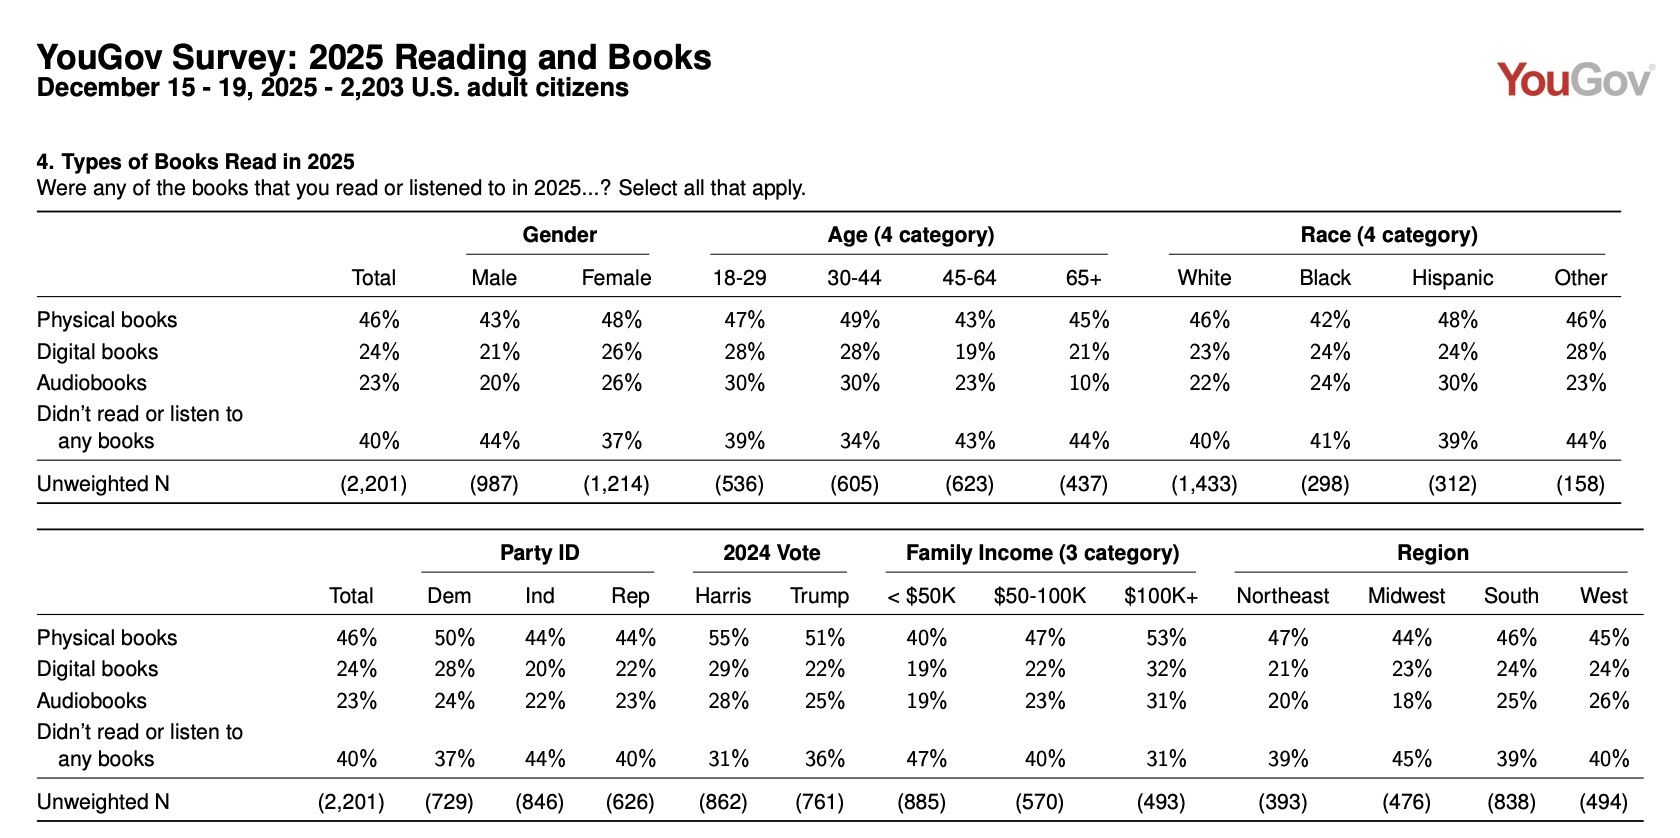
While this question asked participants to select all of the formats that applied in their reading life for 2025, the next question reiterated reader preference for physical books. It asked what format made up the largest share of one’s reading life. Again, across every demographic, physical books were the most commonly consumed.
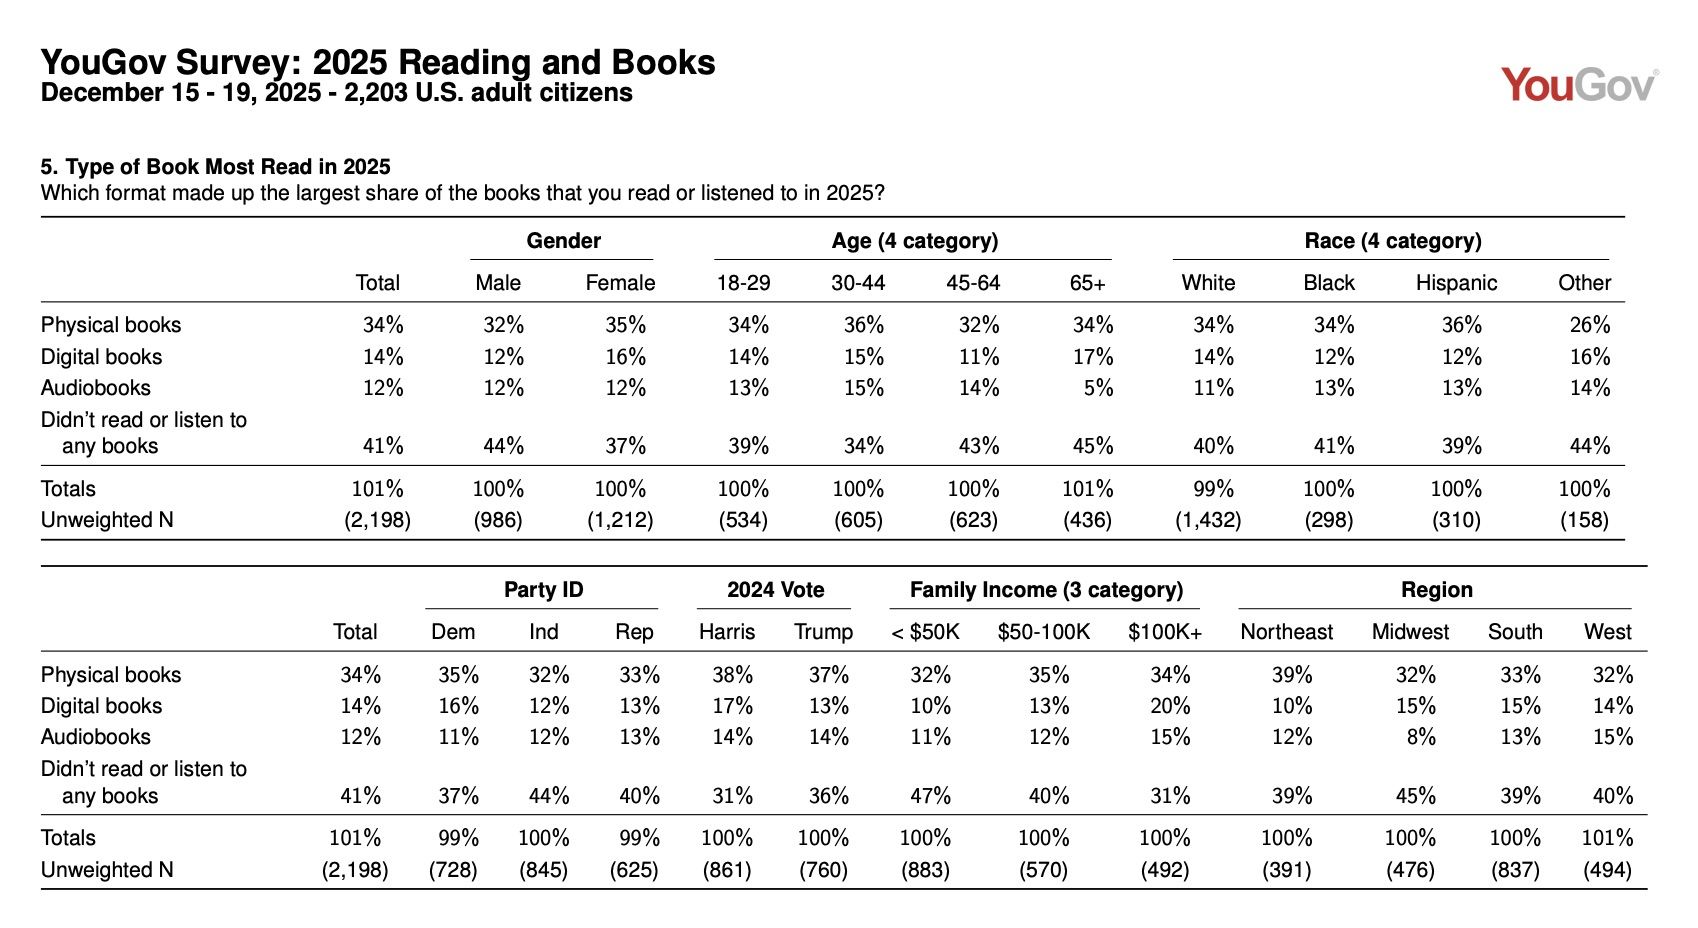
In both questions, readers picked up physical books twice as frequently as digital books and slightly more than twice as much as audiobooks.
Where Readers Find Their Books
The vast majority of those who read a physical book picked up a book that they already owned (84%). But nearly 1/3 utilized the books available at their public library, followed by 24% borrowing a book from someone they knew. Only a small percentage received the book or books they read through a subscription service, at 5%.
- Young people aged 18-29 were borrowing physical books from the library and from their friends more frequently than those in other age categories (38%).
- Democrats were much more likely to borrow books from the library (37%) compared to both Independents (29%) and Republicans (also 29%).
- Readers who voted for Harris in 2024 utilized the library at 39%, compared to Trump voters at 28%.
- Those in the middle income bracket and those who lived in the Midwest also borrowed books from the library more frequently than others.
Another answer option was included in the survey when asked about where readers got their digital books. While 54% of readers enjoyed a digital book they’d already owned, a whopping 40% read a book they found for free online. This isn’t broken out into where or how readers found those books, but it’s likely a healthy mix of public domain titles (such as those on Project Gutenberg) and illegal uploads of copyrighted material. Readers borrowed digital books from the library at 30%, while subscription services for digital books came in much higher than for physical books, at 23%. That’s likely due to programs like Kindle Unlimited. Young people and those in the lowest income brackets were most likely to read digital books they found for free online.
As for audiobooks, 42% of those who’d read a book owned the title, while 35% listened to one they found for free online and 29% borrowed from a library. Again, those free titles online are likely a mix of public domain titles, as well as those illegally accessed through various websites or YouTube. Twenty-six percent of audiobook users got their book from a subscription service, which likely included Audible and Spotify. Again, young people and those in the lowest income brackets were most likely to read digital books they found for free online.
Book Genre Preferences
Mystery and crime books topped the charts with readers in 2025. Twenty-one percent of all readers picked up a book in that genre. Interestingly, demographic differences showed up here, as these books were much more likely to be consumed by white readers than Black readers, at 23% and 13% respectively. Mystery was more commonly read in the American south and by those in the middle and upper income categories.
History books were the second most preferred genre, at 18%. Again, there were some noticeable demographic differences here. While 21% of Hispanic readers preferred history, only 13% of Black readers did. Men read history much more than women, 23% to 13%, and middle age readers from 44-65 read them much less than peers in any other age group. Higher income readers and those in the American west read history more frequently than other categories.
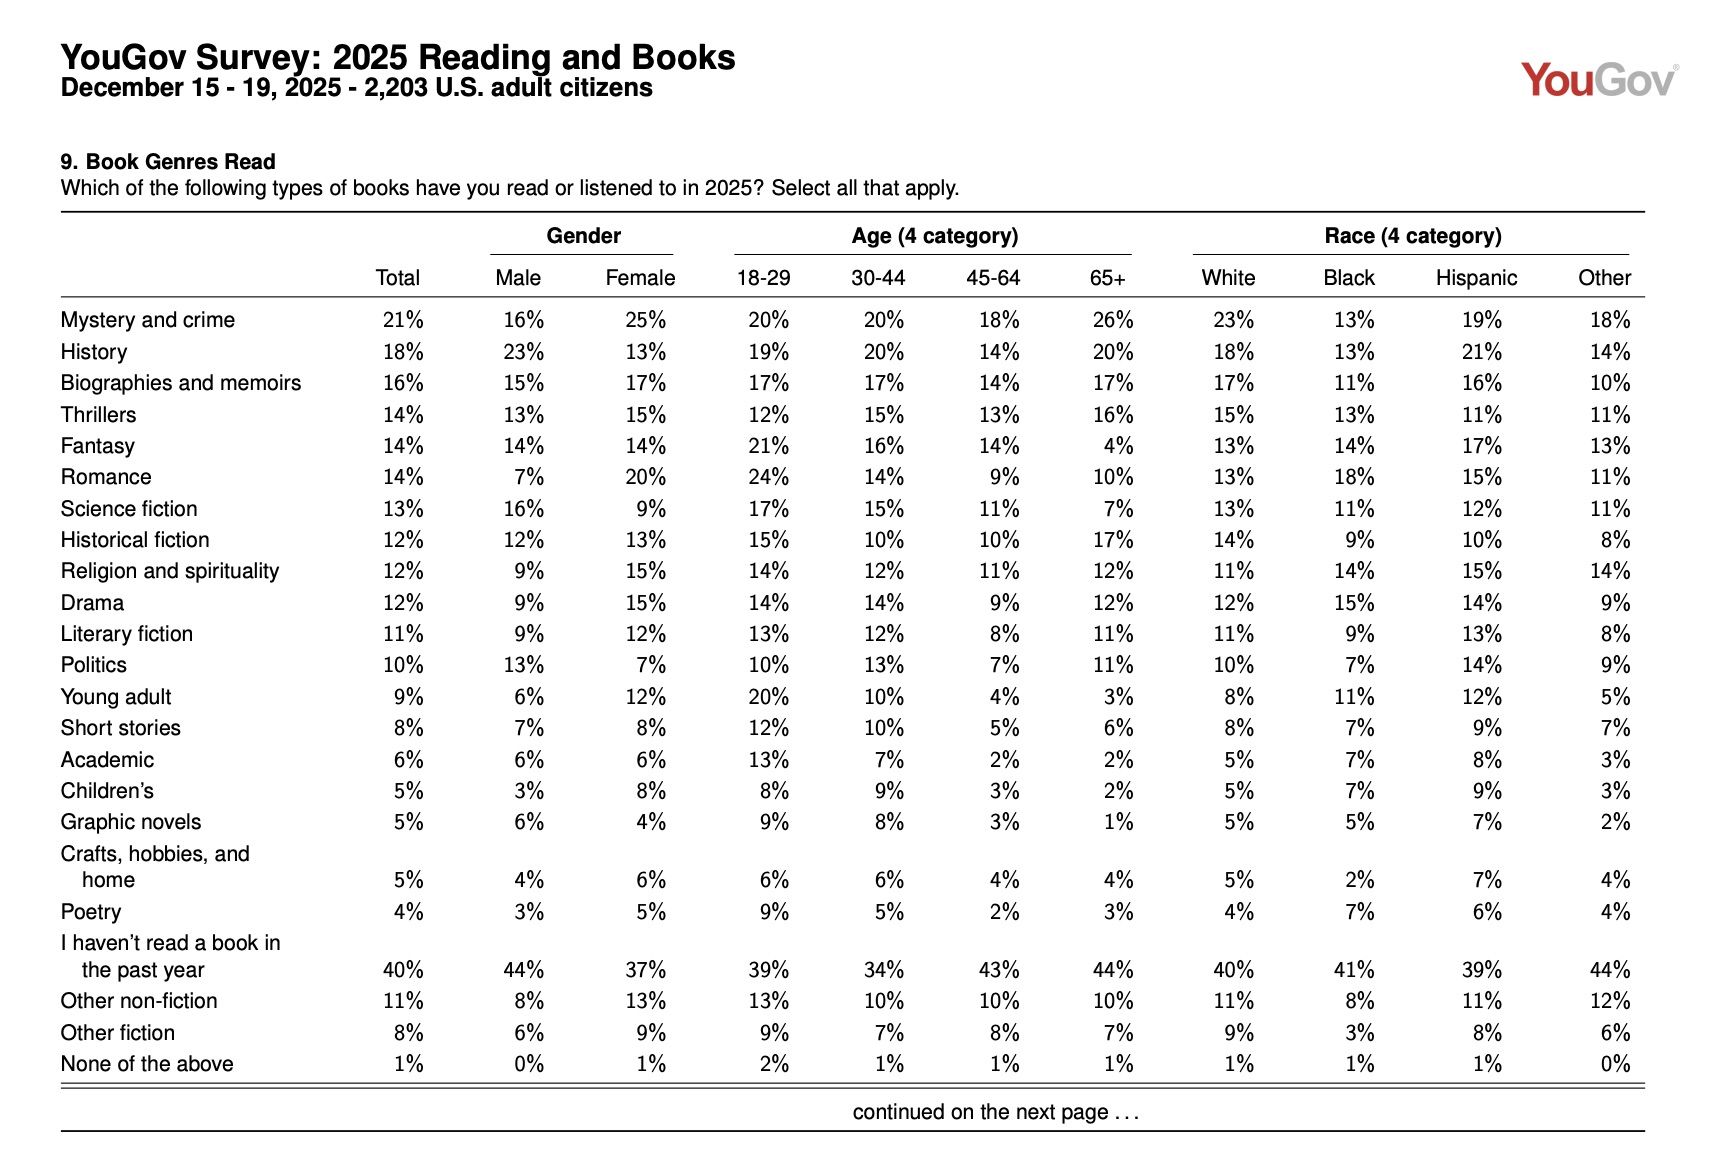
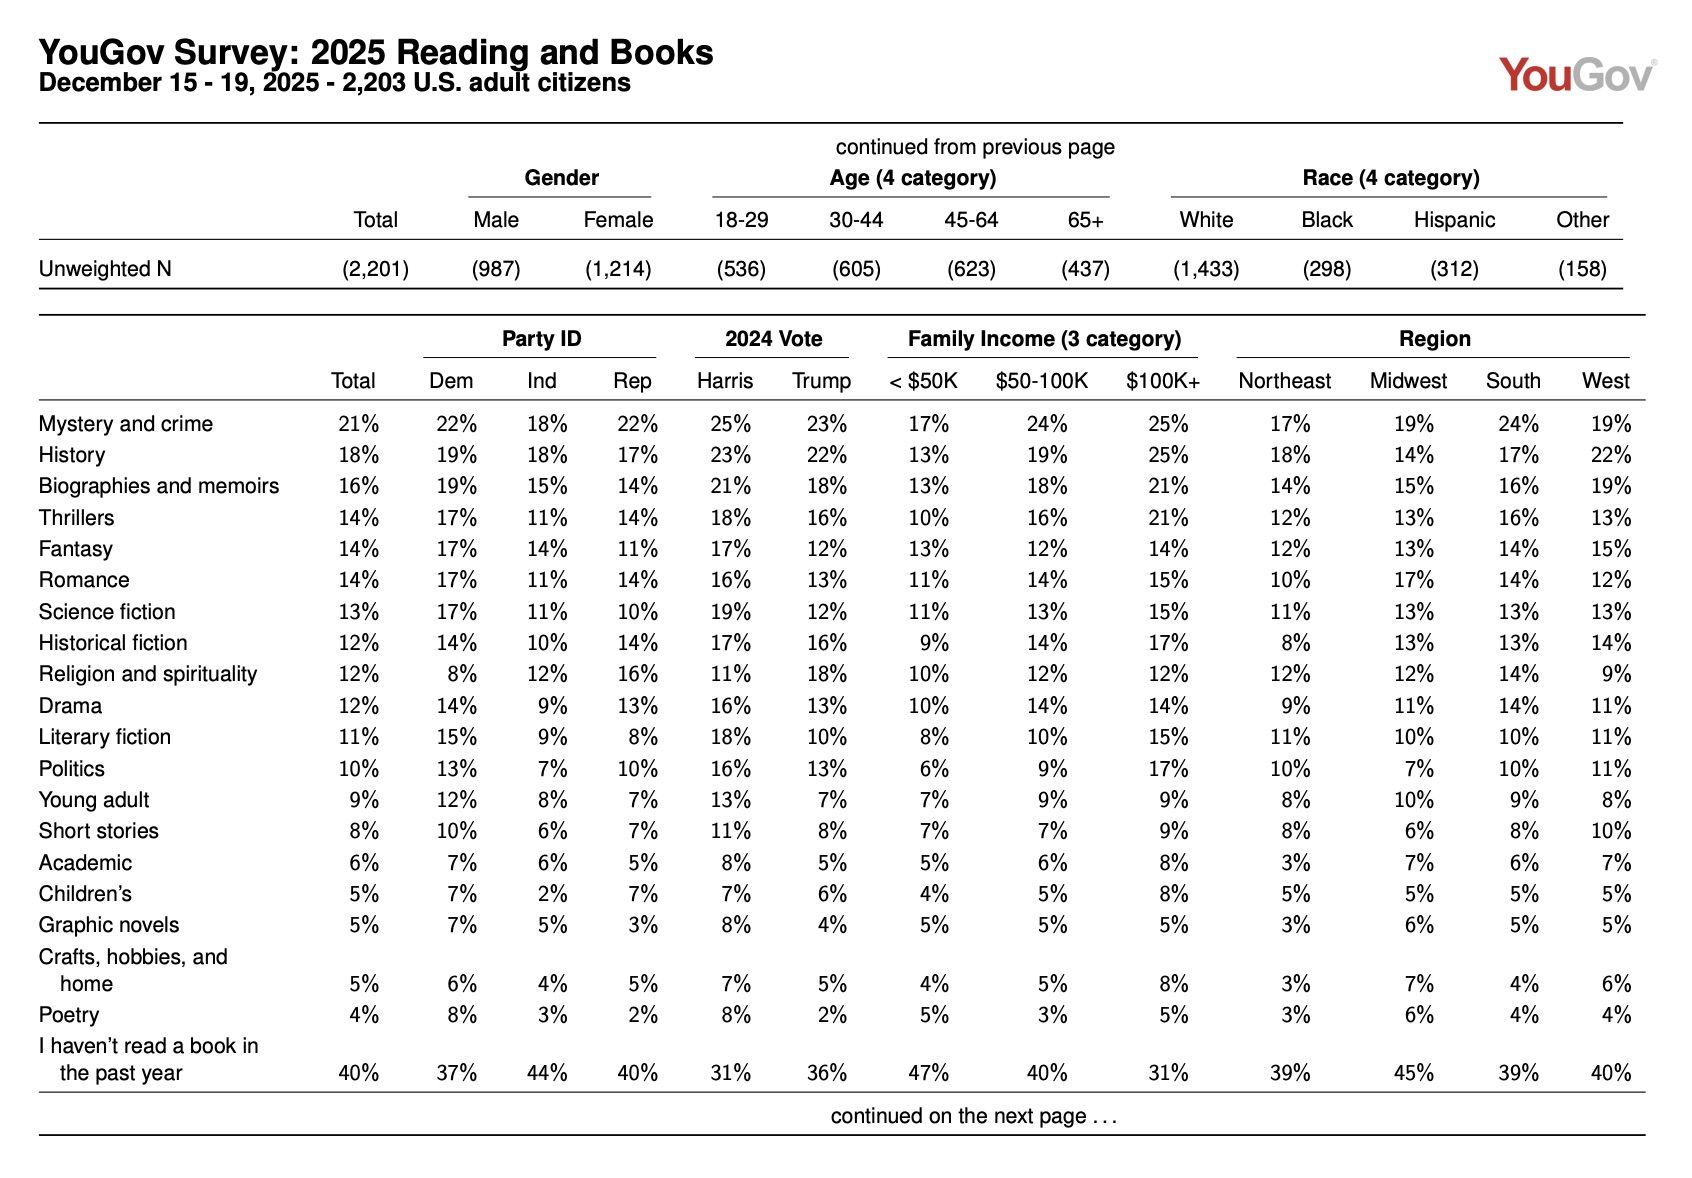
Black readers picked up romance books more than other racial/ethnic identities. Black readers also enjoy drama and poetry more often than their peers.
Book Ownership
The most common number of physical books owned was between 10 and 24, coming in at 19%. Thirteen percent owned between 25 and 49 books, followed by 12% owning between one and four books. Perhaps most heartening in this data set is that only 9% reported owning no books at all.
Looking at the largest percentage of books owned, between 10 and 24, it was most commonly composed of younger readers, age 18 to 24, as well as Hispanic readers. It also favored Republicans and Trump voters, as well as those in the middle income bracket.
At the extreme ends, those who owned zero books (9%) were more frequently age 30-44, identified as Black, considered themselves Independent in political partisanship, lower income, and from the western area of the United States. Those who owned more than 1,000 books (2%) were over 65, “Other” in racial identity, Democrats, Harris voters, from higher income households, and lived in the midwest.
Ownership of digital books looked much different than ownership of physical books. More than half of respondents–55%–stated they owned no digital books. The next most common number owned? Between one and four. Only 1% owned more than 1,000 digital books, and the demographics of those readers mirrored the demographics of those who owned that number of physical books.
Given those numbers, it is likely of little surprise that audiobook ownership is also lower than ownership of physical books. Seventy percent of responses said they owned zero audiobooks, followed by 11% owning between one and four. Zero percent owned 500 or more audiobooks.
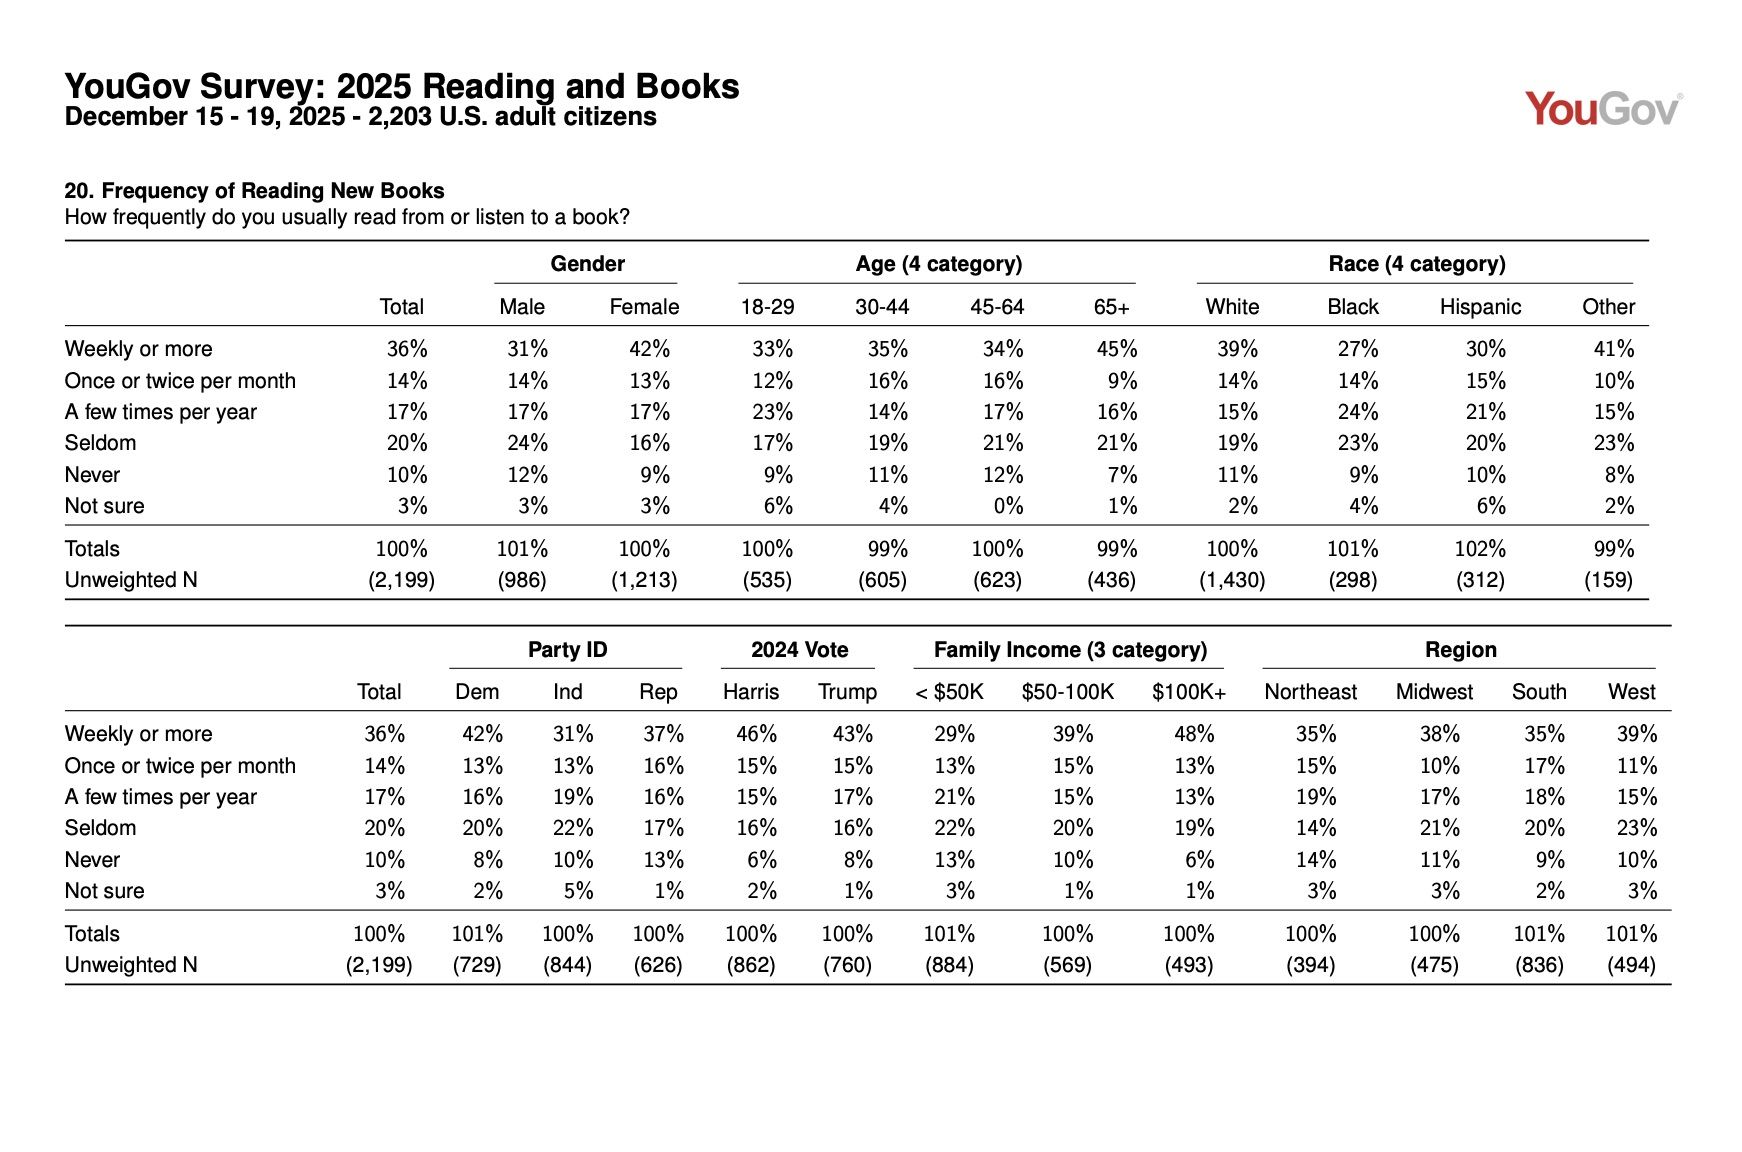
Frequency of Reading New Books
Readers appear to be all-or-nothing when it comes to reading or listening to a book. Thirty-six percent read at least once a week, with women, those age 65+, people who identify as “Other” in race or ethnicity, Democrats, Harris voters, higher incomes, and those living in the American west indicating this most frequently.
On the other extreme, 20% of survey takers indicated that they “seldom” read–this option implied reading more often than never but less often than “a few times a year.” Men, those in the 45-64 and 65+ age groups, Black and “Other” backgrounds, Independent affiliation, lower incomes, and residing in the American west were most likely to select this answer.
How Readers Organize and Utilize Their Books
For all of the ideas, suggestions, and debates that organizing books can inspire on the internet, the fact is that most people don’t organize their books (38%).
- Seventeen percent each organize their books by genre or subject and by book size.
- Next in popularity is organizing books by author (7%), then 4% each for alphabetically by title and “another system.”
- Only 1% organized their books by color, most commonly younger women with higher incomes.
- Another 1% organized by a formal system like the Dewey Decimal System or Library of Congress.
Those organization systems work for their users, too. The vast majority said they can find the books they’re looking for “very easily” (44%) or “somewhat easily” (42%).
Book owners also read their books. Twenty-five percent indicated they’ve read all of their books, while 40% noted they’ve read “most” of their books. That said, while some people often reread the books they own (7%), most indicate they reread either “not very often” (27%), “not at all often” (18%), or “never” (8%).
All Of The Data on Library Use
In an era of rampant book banning and attacks on public libraries, what do readers have to say about where and how they access these institutions? As data has shown in numerous previous studies, including the Knight Foundation, EveryLibrary and Book Riot, and so many more, most people appreciate their access to a public library.
Over half–51%–of those surveyed had a public library card. Black readers, women, and those over the age of 65 were most likely to have a public library card, as were those with incomes over $100,000 and those living in the midwest. Some of the differences between the groups were quite large: 59% of women owned a library card compared to 41% of men; 58% of those over the age of 65 had a library card, compared to only 41% of those between 18 and 29. This suggests that perhaps there’s room to remind young readers the power of the public library and to encourage them to sign up for a card. There’s room here to build programming and resources targeting emerging adults, whether or not they have children.
There were some meaningful differences in library card ownership based on political views, as well. While 58% of democrats had a library card, 48% of independents and 49% of republicans did. It is worth noting that both 2024 Harris voters and Trump voters had more than half their respondents indicate library card ownership, 65% and 53% respectively.
The next series of questions were asked only to those who had a library card, and they reveal something worth exploring more in depth: most people who have a library card, regardless of their demographic background, rarely or never utilize the physical, digital, or audiobook materials in the library. But that does not mean they’re not using the library itself.
- Physical books accounted for 23% of “rarely” responses
- 29% said they “never” utilize digital books
- 31% say they “never” utilize audiobooks
A small number of regular library users comprise the bulk of library use, despite the fact over half the survey respondents had a library card. Those small number of users focused on physical books.
Perhaps a bright spot, though, is that a lower percentage of people “rarely” or “never” utilized the library as a physical space. Just 17% “rarely” used the library and 20% “never” use the library space. Seven percent are monthly library users, 4% are weekly users, and 2% are daily users of library spaces. These numbers provide some insight into the necessity and utility of public spaces of civic engagement, free from the expectation of consumption. It is likely that regular use of library spaces is actually higher among survey respondents; these questions were asked only to card holders. Public libraries themselves mostly do not require library cards to visit, meaning non-card holders can go in and read, study, or access wireless internet.
Again, the above only represents a portion of the survey conducted by YouGov. It’s an illuminating look at American reading habits across demographics representative of America’s population more broadly. It’s a small study–just over 2,200 people–but it presents plenty of insight to chew on and consider when it comes to where and how readers are best reached, where and how they’re reading, and where and how public libraries play a role in the lives of everyday Americans.
It’s also a fascinating look at where and how people continue to read amid political upheaval, as well as increasing socioeconomic challenges. It might not be at rates that would be ideal, but reading a book is only one measure of what counts as being a reader.
This information also may point the finger back at ourselves when it comes to the reported literacy crisis in the country, as well as the increased dependence on Artificial Intelligence to do the challenging intellectual work of reading, interpreting, and digesting written materials. In an era where few high schoolers read a full book as part of their education anymore; where professionalism and expertise are undermined at every turn; and where accessing books that interest young readers becomes harder and harder thanks to continued pressure to ban materials, adults bear significant responsibility for modeling the behavior they wish to see in those of younger generations.
You can check out all of the survey’s questions and responses here. YouGov offers some of their own analysis as well.
Read the original article here